
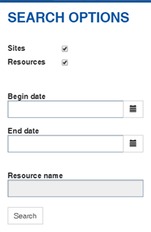
When you select the Drilling Efficiency report, a map and a search toolbox will be displayed. The search toolbox can be used to search for Sites and/or Resources and their average drilling speeds within a chosen timespan. If the date fields are left blank, the report will cover their whole lifetimes. If only sites are being searched, they can be filtered to only include ones where a certain resource has worked.
If drilling has taken place between the chosen times, the map will show all the sites and resources which have done drilling.
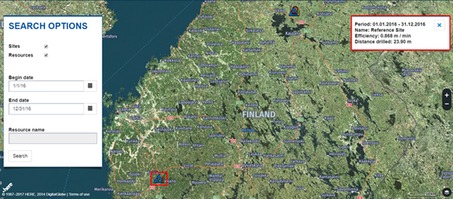
By clicking a site or a resource icon, more information will be presented. The bars next to the site icon represent the average drilling speed on the site in the chosen timespan. The more bars are displayed, the more difficult, i.e. slower, the drilling has been. The resource icon has a speedometer above it indicating how fast the resource has drilled in the chosen timespan. The more right the pointer shows, the faster the resource has drilled.